Two important terms help us understand their effect on blood sugar:
Understanding both GI and GL helps in better food choices, especially for diabetes, PCOS, insulin resistance, and weight management.
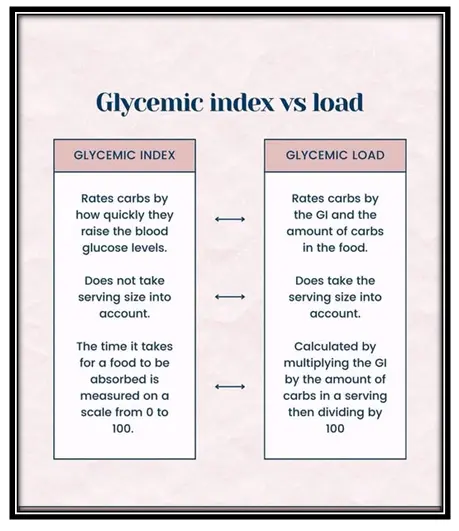
Glycemic Index tells us how quickly a carbohydrate-containing food raises blood glucose compared to pure glucose.
GI CATEGORIES:
Low GI: 55 or less
Medium GI: 56–69
High GI: 70 and above
COMMON GI VALUES:
LIMITATION OF GI:
GI does not consider how much food you actually eat.
A food may have a high GI but still cause only a small sugar rise if eaten in a small quantity.
|
Low Glycemic Index (55 or less) Choose Most Often |
Medium Glycemic Index (56 to 69) Choose Less Often |
High Glycemic Index (70 or more) Choose Least Often |
|
Breads: Heavy Mixed Grain Breads Spelt Bread Sourdough Bread Tortilla (Whole Grain) |
Breads: Chapati (White, Whole Wheat) Flaxseed/Linseed Bread Pita Bread (White, Whole Wheat) Pumpernickel Bread Roti (White, Whole Wheat) Rye Bread (Light, Dark, Whole Grain) Stone Ground Whole Wheat Bread Whole Grain Wheat Bread |
Breads: Bread (White, Whole Wheat) Naan (White, Whole Wheat) |
|
Cereal: All-BranCereal All-Bran Buds With Psyllium Cereal Oat Bran Oats (Steel Cut) |
Cereal: Cream of Wheat(Regular) Oats (Instant) Oats (Large Flake) Oats (Quick) |
Cereal: All-Bran FlakesCereal Corn FlakesCereal Cream of Wheat(Instant) Puffed Wheat Cereal Rice Krispies Cereal Special K Cereal |
|
Grains: Barley Bulgur Mung Bean Noodles Pasta (Al Dente, Firm) Pulse Flours Quinoa Rice (Converted, Parboiled) |
Grains: Basmati Rice Brown Rice Cornmeal Couscous (Regular, Whole Wheat) Rice Noodles White Rice (Short, Long Grain) Wild Rice |
Grains: Jasmine Rice Sticky Rice White Rice (Instant) |
|
North Indian: Multigrain roti (atta + chana/soya/barley) Barley (jau) roti Besanchilla Moong dal chilla |
North Indian: Whole wheat roti (plain atta) Missi roti Dalia (broken wheat) |
North Indian: Maida roti Naan Bhatura |
|
South Indian: Red rice (matta/parboiled Kerala rice) – controlled portion Parboiled rice (small portion) Ragidosa Ragiidli |
South Indian: Plain dosa Idli Lemon rice (controlled portion) |
South Indian: White polished rice Pongal (white rice based) Thin rice flakes (poha/aval) |
|
Other: Peas Popcorn Sweet Potato Winter Squash Low Gi potato |
Other: Beets* Corn French Fries Parsnip Potato (Red, White, Cooled) Rye Crisp Crackers (e.g. Ryvita Rye Crispbread) Stoned Wheat Thins Crackers |
Other: Potato (Instant Mashed) Potato (Red, White, Hot) Pretzels Rice Cakes Soda Crackers |
* Most starchy/sweet vegetables (e.g. peas, parsnip, winter squash) provide 15 g or more carbohydrate per 1 cup serving. Beets and carrots often provide less than 15 g carbohydrate per serving (marked above with *). Most non-starchy vegetables have a GI below 20 or are not assigned a GI because their carbohydrate content is too low to significantly affect blood glucose.
|
Low Glycemic Index (55 or less) Choose Most Often |
Medium Glycemic Index (56 to 69) Choose Less Often |
High Glycemic Index (70 or more) Choose Least Often |
|
Apple Apricot (Fresh, Dried) Banana (Green, Unripe) Berries Cherries (Fresh) Cantaloupe Grapefruit Honeydew Kiwi Melon Orange Peach Pear Plum Pomegranate Prunes |
Banana (Ripe, Yellow) Cherries (Bottled) Cranberries (Dried) Figs (Fresh, Dried) Grapes Kiwi Lychee Pineapple Raisins Mango |
Banana (Brown, Overripe) Watermelon |
|
Low Glycemic Index (55 or less) Choose Most Often |
Medium Glycemic Index (56 to 69) Choose Less Often |
High Glycemic Index (70 or more) Choose Least Often |
|
Almond Milk Cow Milk (Skim, 1%, 2%, Whole) Frozen Yogurt Greek Yogurt Soy Milk Yogurt (Skim, 1%, 2%, Whole) |
|
Rice Milk |
|
Low Glycemic Index (55 or less) Choose Most Often |
Medium Glycemic Index (56 to 69) Choose Less Often |
High Glycemic Index (70 or more) Choose Least Often |
|
Baked Beans Chickpeas Kidney Beans Lentils Mung Beans Romano Beans Soybeans/Edamame Split Peas |
Lentil Soup (ready-made) Split Pea Soup (ready-made) |
|
Meat, poultry, and fish have a GI of zero / not applicable because they contain no carbohydrate and do not raise blood glucose levels. Pulses (such as lentils, beans, and chickpeas) contain carbohydrates, but they have a low glycaemic index. When ½ cup or more of cooked pulses is eaten, the carbohydrate amount becomes significant, so they are counted in the grains and starches group for GI and carbohydrate exchanges. In smaller amounts, pulses may be counted as meat or protein alternatives.
REFERENCE:
|
FOOD |
Glycemic index (glucose = 100) |
Serving size (grams) |
Glycemic load per serving |
|
BAKERY PRODUCTS AND BREADS |
|||
|
White wheat flour bread |
71 |
30 |
10 |
|
Wonder bread, average |
73 |
30 |
10 |
|
Whole wheat bread, average |
71 |
30 |
9 |
|
100% Whole Grainbread (Natural Ovens) |
51 |
30 |
7 |
|
Pita bread, white |
68 |
30 |
10 |
|
Corn tortilla |
52 |
50 |
12 |
|
Wheat tortilla |
30 |
50 |
8 |
|
BEVERAGES |
|||
|
Coca Cola®, average |
63 |
250 mL |
16 |
|
Fanta®, orange soft drink |
68 |
250 mL |
23 |
|
Apple juice, unsweetened, average |
44 |
250 mL |
14 |
|
Gatorade |
78 |
250 mL |
12 |
|
Orange juice, unsweetened |
50 |
250 mL |
12 |
|
Tomato juice, canned |
38 |
250 mL |
4 |
|
BREAKFAST CEREALS AND RELATED PRODUCTS |
|||
|
All-Bran™, average |
55 |
30 |
12 |
|
Cornflakes™, average |
93 |
30 |
23 |
|
Muesli, average |
63 |
30 |
16 |
|
Oatmeal, average |
55 |
250 |
13 |
|
Instant oatmeal, average |
83 |
250 |
30 |
|
Puffed wheat, average |
80 |
30 |
17 |
|
Raisin Bran™ (Kellogg's) |
61 |
30 |
12 |
|
Special K™ (Kellogg's) |
69 |
30 |
14 |
|
GRAINS |
|||
|
Pearled barley, average |
28 |
150 |
12 |
|
Sweet corn on the cob, average |
60 |
150 |
20 |
|
Couscous, average |
65 |
150 |
9 |
|
Quinoa |
53 |
150 |
13 |
|
White rice, average |
89 |
150 |
43 |
|
Quick cooking white basmati |
67 |
150 |
28 |
|
Low GI rice: |
50 |
30 |
14 |
|
Red rice (matta) |
45 |
30 |
12 |
|
Brown rice, average |
50 |
150 |
16 |
|
Whole wheat kernels, average |
30 |
50 |
11 |
|
COOKIES AND CRACKERS |
|||
|
Vanilla wafers |
77 |
25 |
14 |
|
Shortbread |
64 |
25 |
10 |
|
Rice cakes, average |
82 |
25 |
17 |
|
Rye crisps, average |
64 |
25 |
11 |
|
DAIRY PRODUCTS AND ALTERNATIVES |
|||
|
Ice cream, regular |
57 |
50 |
6 |
|
Milk, full fat |
41 |
250 mL |
5 |
|
Milk, skim |
32 |
250 mL |
4 |
|
Reduced-fat yogurt with fruit, average |
33 |
200 |
11 |
|
FRUITS |
|||
|
Apple |
39 |
120 |
6 |
|
Banana, ripe |
62 |
120 |
16 |
|
Dates, dried |
42 |
60 |
18 |
|
Grapefruit |
25 |
120 |
3 |
|
Grapes |
59 |
120 |
11 |
|
Orange |
40 |
120 |
4 |
|
Peach |
42 |
120 |
5 |
|
Pear |
38 |
120 |
4 |
|
Prunes, pitted |
29 |
60 |
10 |
|
Raisins |
64 |
60 |
28 |
|
Watermelon |
72 |
120 |
4 |
|
BEANS AND NUTS |
|||
|
Baked beans, average |
40 |
150 |
6 |
|
Blackeye peas, average |
33 |
150 |
10 |
|
Black beans |
30 |
150 |
7 |
|
Chickpeas, average |
10 |
150 |
3 |
|
Chickpeas, canned in brine |
38 |
150 |
9 |
|
Kidney beans, average |
29 |
150 |
7 |
|
Lentils, average |
29 |
150 |
5 |
|
Soybeans, average |
15 |
150 |
1 |
|
Cashews, salted |
27 |
50 |
3 |
|
Peanuts, average |
7 |
50 |
0 |
|
VEGETABLES |
|||
|
Green peas, average |
51 |
80 |
4 |
|
Carrots, average |
35 |
80 |
2 |
|
Parsnips |
52 |
80 |
4 |
|
Baked russet potato, average |
111 |
150 |
33 |
|
Boiled white potato, average |
82 |
150 |
21 |
|
Instant mashed potato, average |
87 |
150 |
17 |
|
Sweet potato, average |
70 |
150 |
22 |
|
Yam, average |
54 |
150 |
20 |
REFERENCE-https://www.scribd.com/document/337729212/Glycemic-Index-and-Load
Glycaemic Load (GL) tells us how much a food will actually raise blood sugar after we eat a normal portion.
Unlike GI alone, GL gives a more realistic picture of blood sugar response in daily life.
GL considers two things:
Because it includes both quality and quantity of carbohydrates, GL is more practical for everyday meals.
GL CATEGORIES
Watermelon (1 cup)
White rice (1 bowl, cooked)
Apple (1 medium)
Banana (1 medium)
Oats (rolled, cooked)
White bread (1 slice)
We rarely eat foods alone. Most meals contain:
These slow digestion and reduce the speed and extent of blood sugar rise.
This is why GL is more meaningful than GI alone.
✔ Do not avoid foods only because their GI is high
✔ Focus on portion control to keep GL low
✔ Combine carbohydrates with protein, fat, and fibre
✔ Aim for low to medium GL meals most of the time
GI is like knowing how fast a car can go.
GL is knowing how far the car actually travels.
Blood sugar control depends on the total journey, not just the speed.


